Understanding Your Analytics Dashboard
Your Analytics Dashboard provides a complete overview of your app's performance, traffic, and user engagement.
Accessing Your Dashboard
- Go to My Apps
- Click on your app
- The Analytics Dashboard is the default view
Or click "Dashboard" in the app navigation if you're on a different analytics page.
Dashboard Sections
Date Range Selector
Located in the top right:
- 7 days: Quick weekly snapshot
- 30 days: Monthly overview (default)
- 90 days: Quarterly trends
- Custom: Select specific dates
Changes apply to all dashboard data instantly (partial page reload).
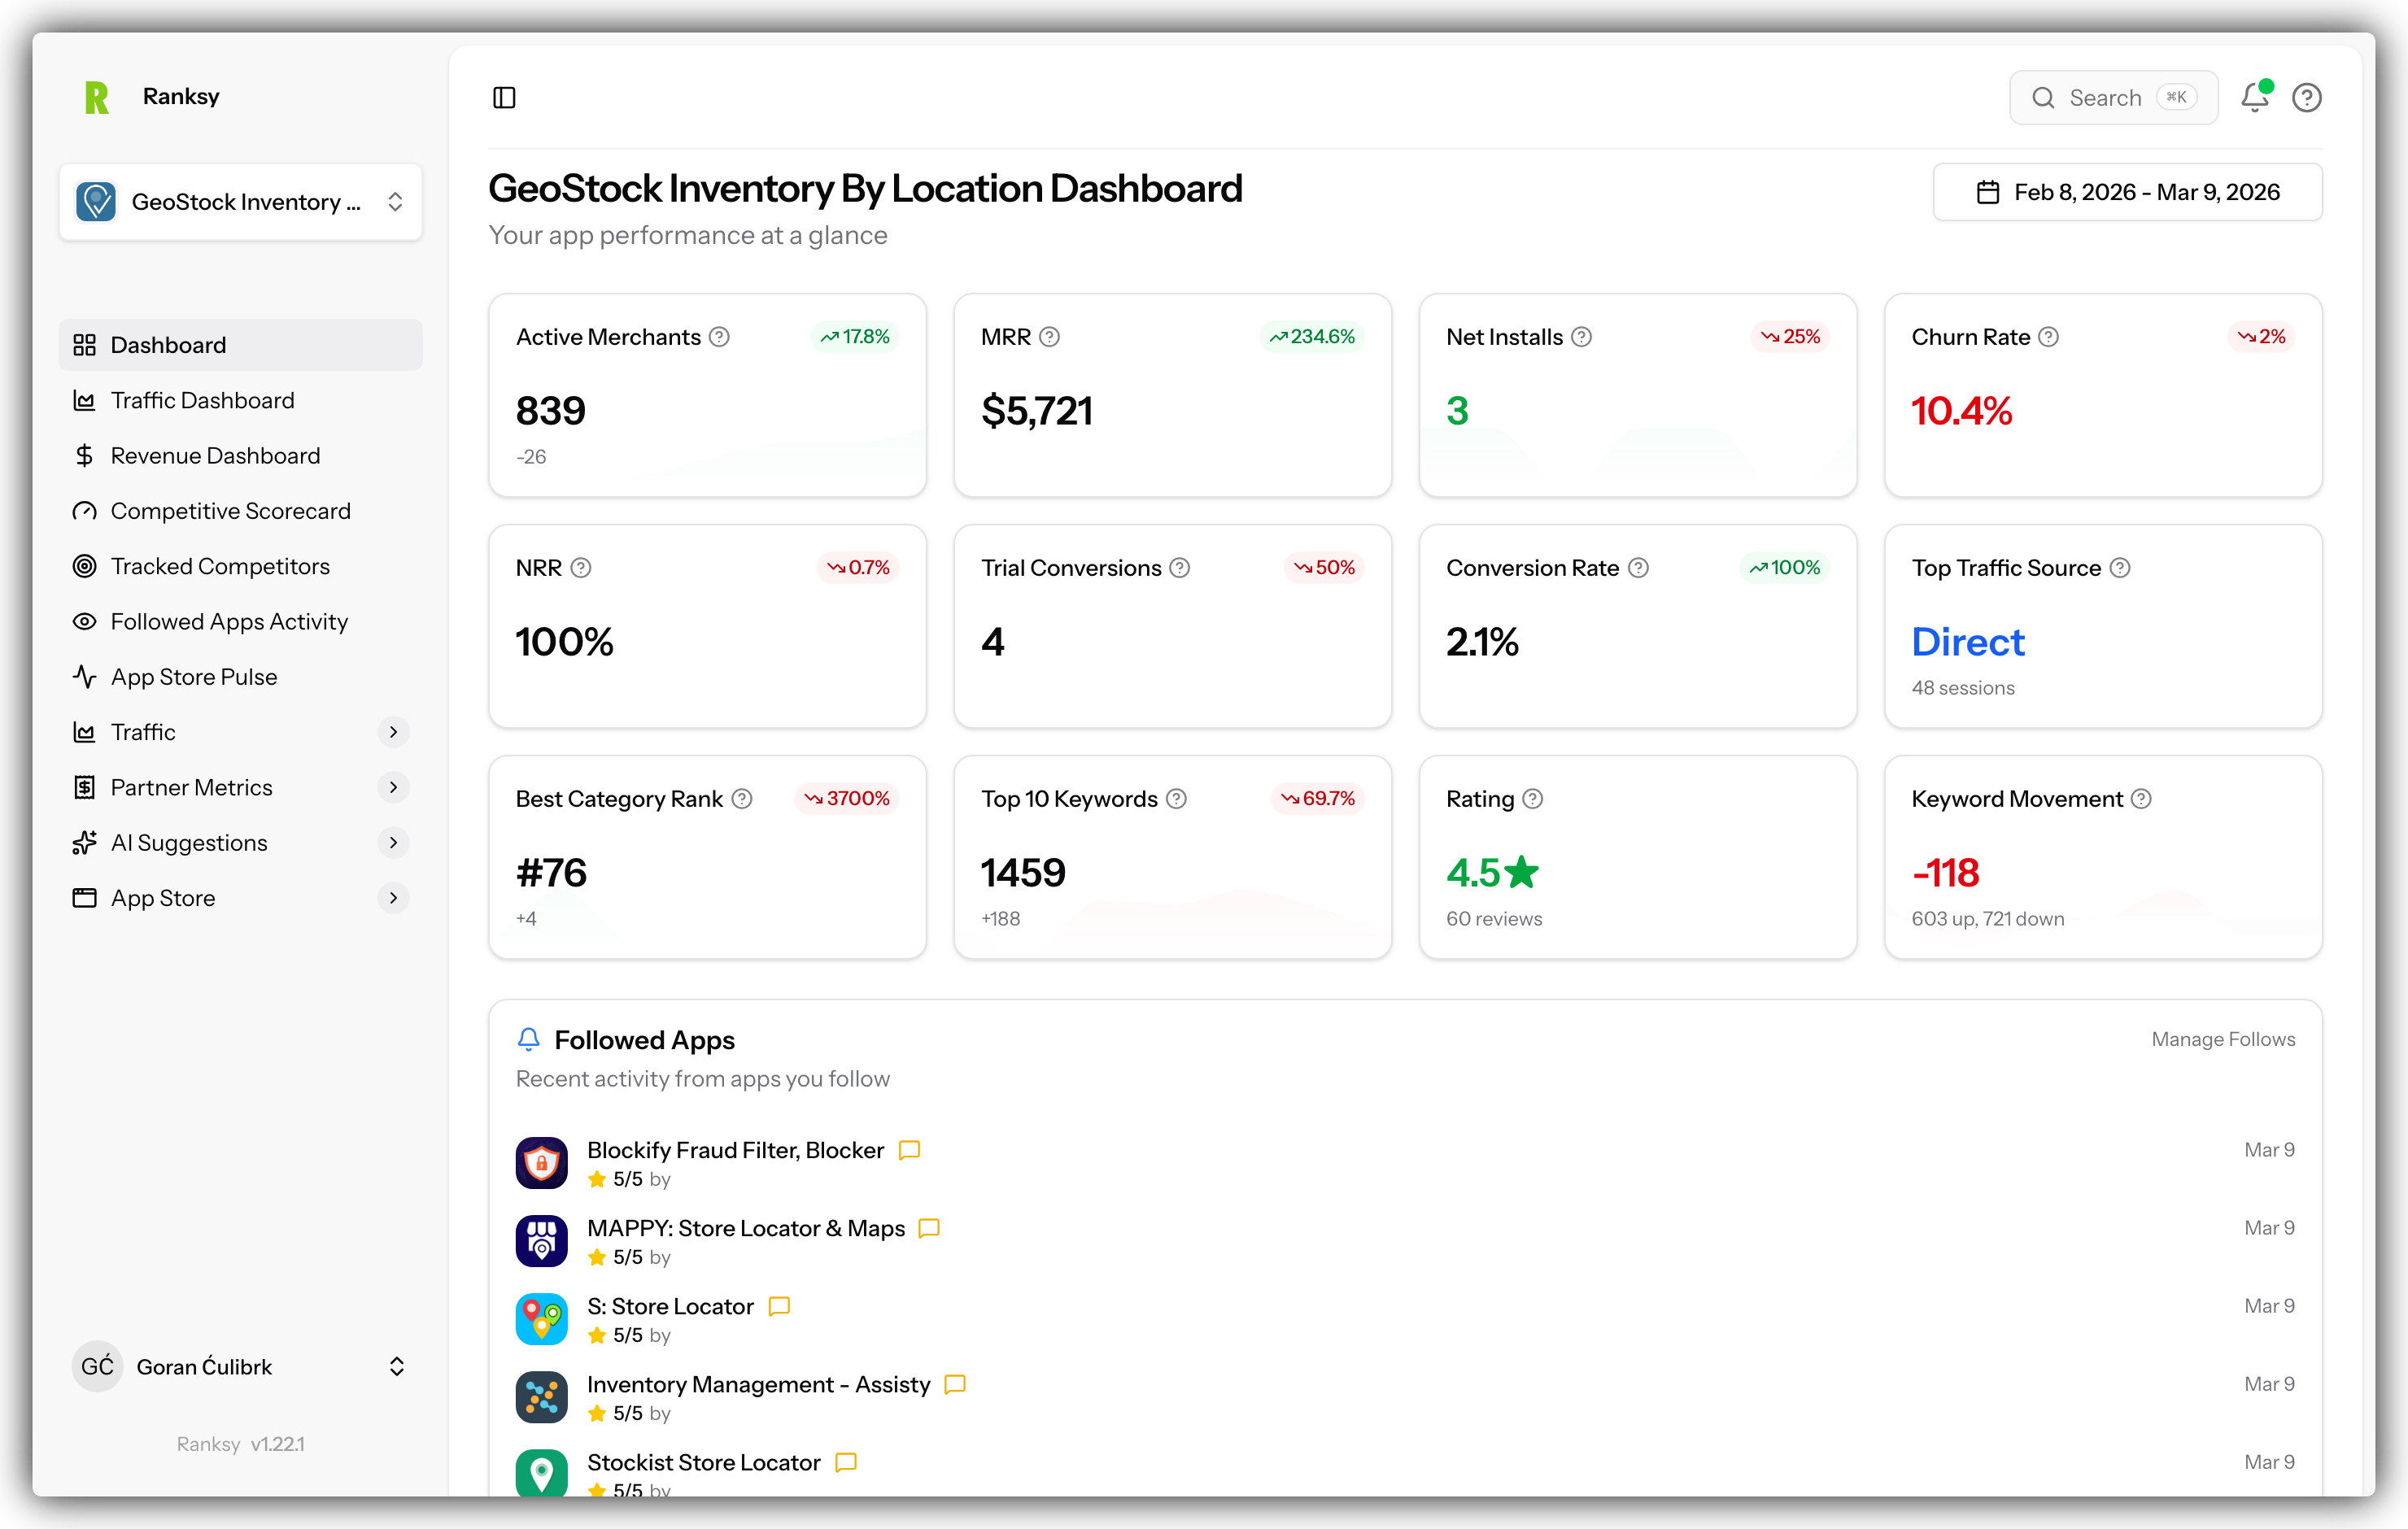
Overview Metrics Cards
Four key metrics at the top:
Pageviews
- Total people who viewed your app listing
- Percentage change vs previous period
- ↑ Green = increasing, ↓ Red = decreasing
Add App Clicks
- Users who clicked "Add app" button
- Strong intent signal
- Tracks towards conversion funnel
Installs
- Actual app installations
- Final conversion step
- Revenue opportunity
Revenue (if Partner API connected)
- Total revenue for period
- Includes all subscription types
- Percentage change vs previous period
Daily Events Chart
Line chart showing trends over time:
- Blue line: Pageviews (traffic)
- Green line: Add App Clicks (interest)
- Purple line: Installs (conversions)
What to look for:
- Spikes (feature launches, marketing campaigns)
- Drops (issues, increased competition)
- Patterns (weekday vs weekend, seasonality)
Hover over any point for exact numbers and date.
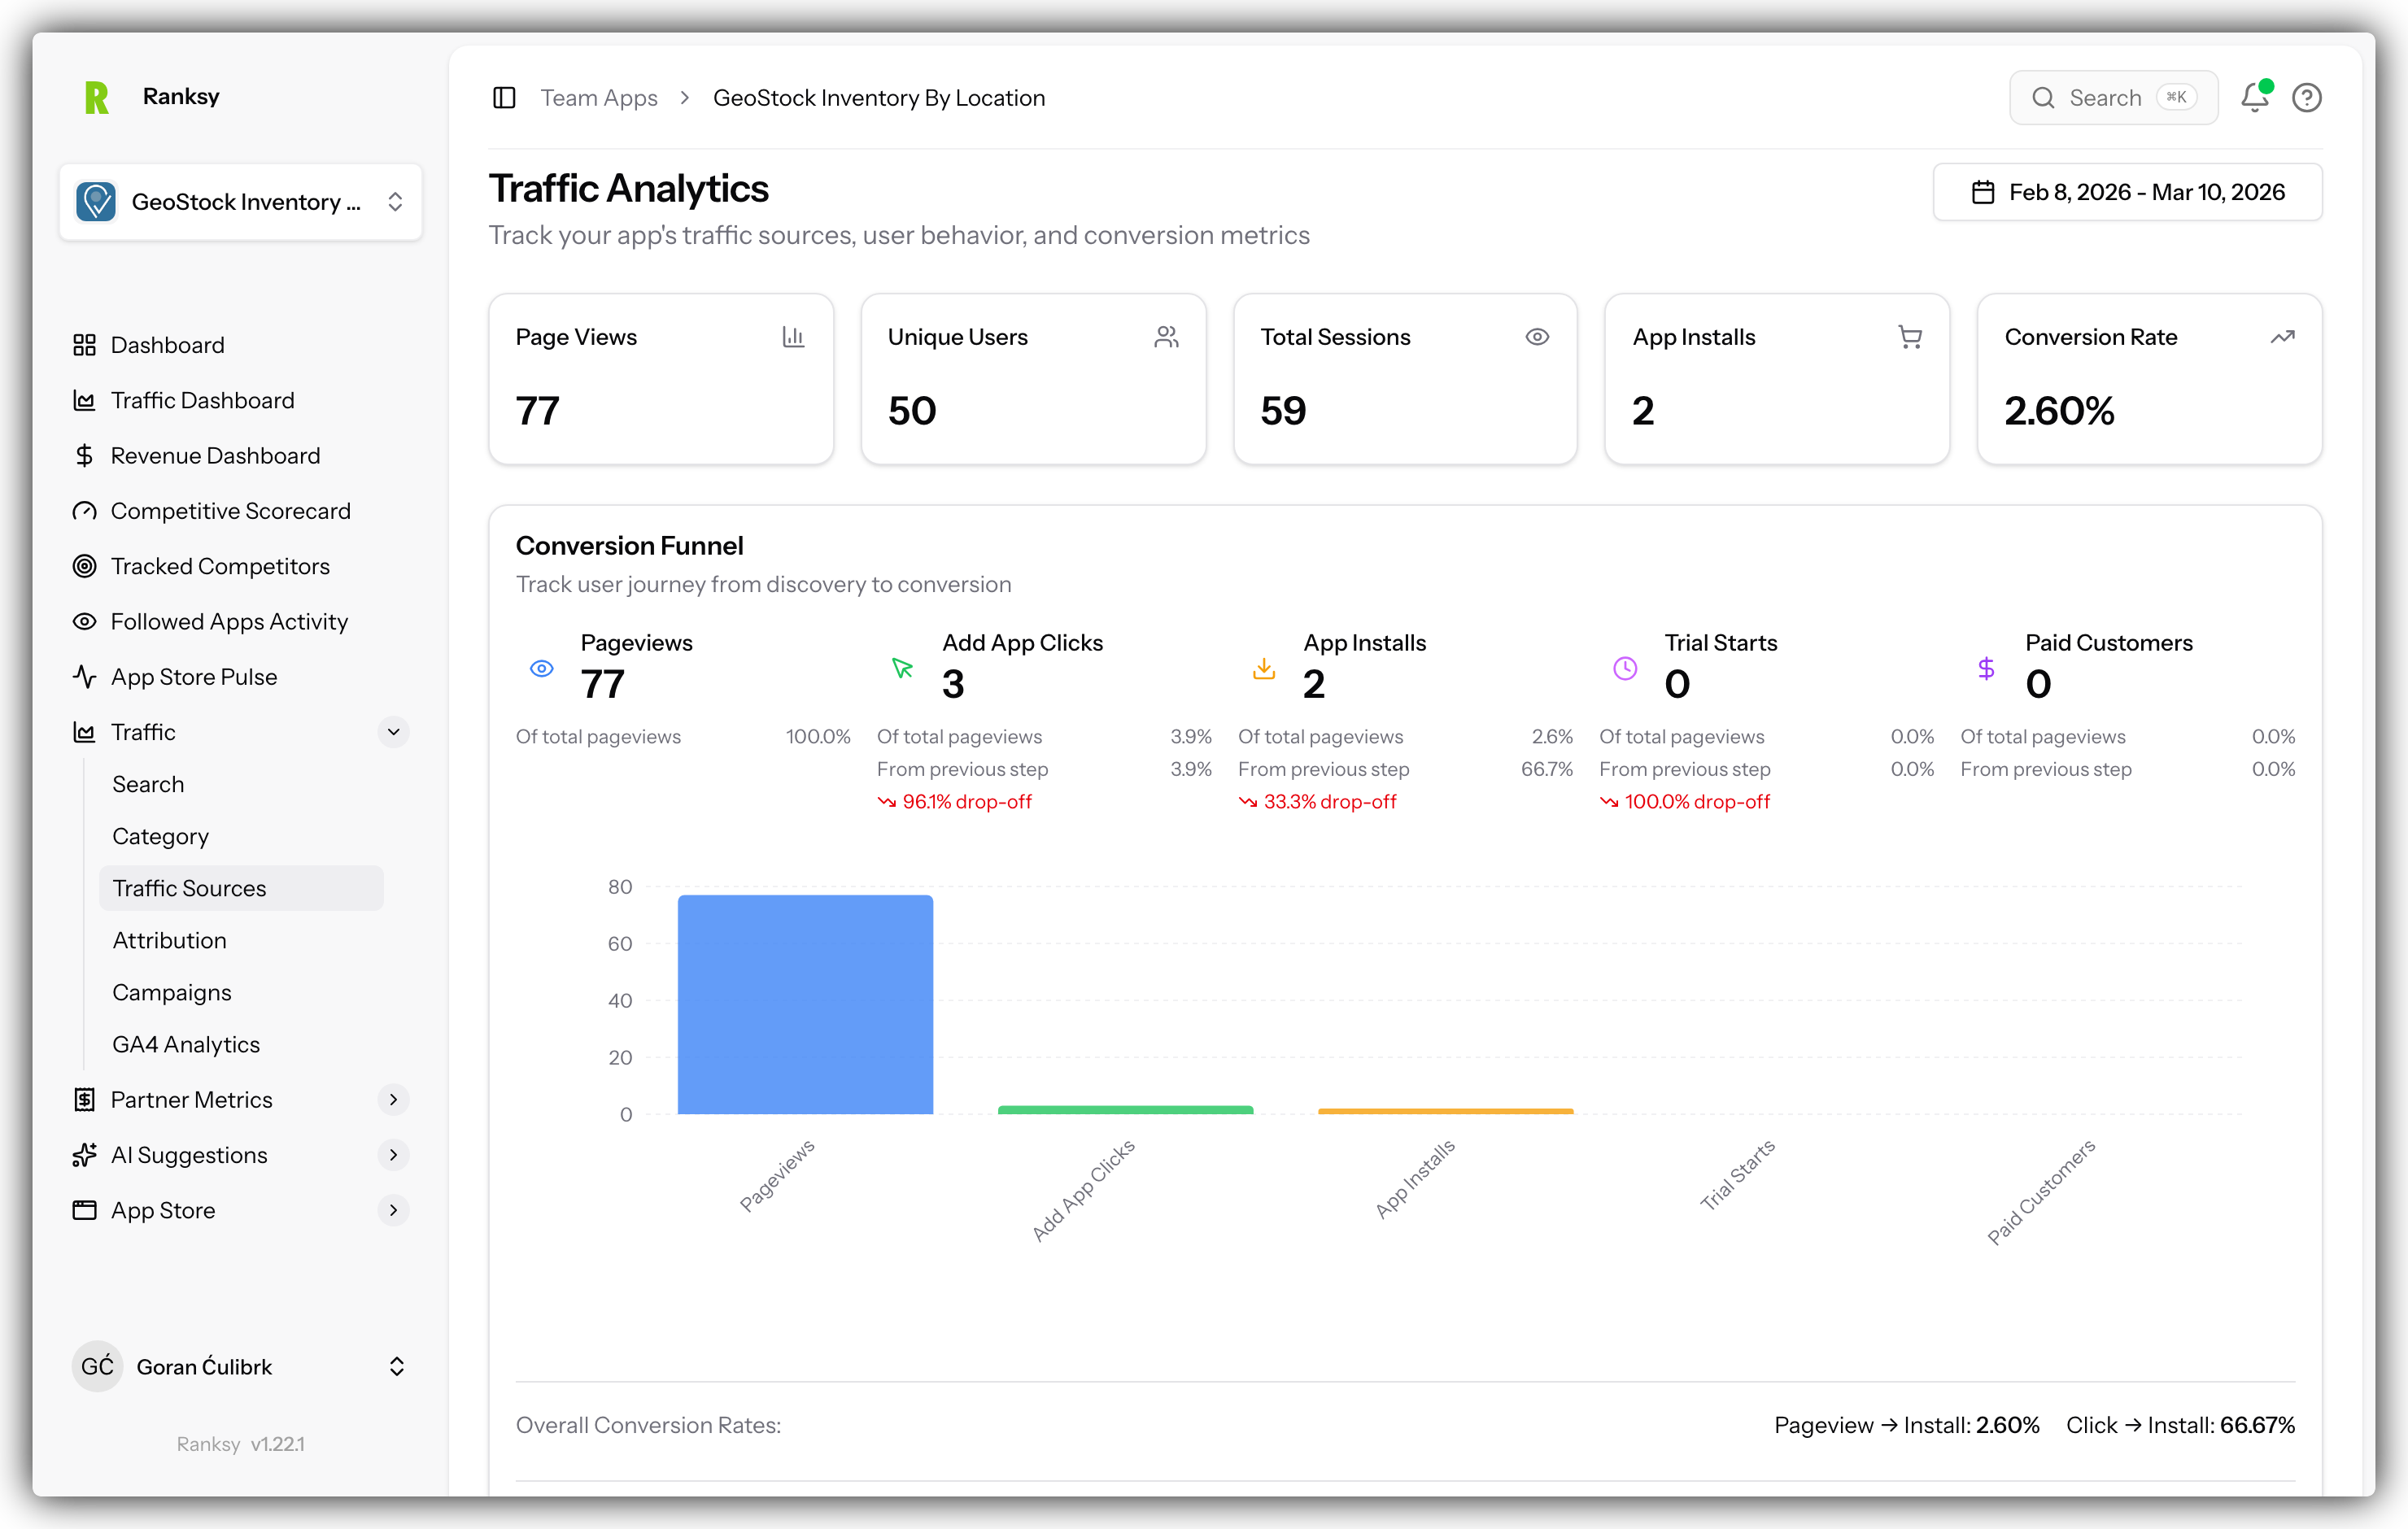
Mini Conversion Funnel
Visual funnel showing drop-off at each stage:
Pageviews → Add App Clicks → Installs
Each stage shows:
- Count: Number of users
- Conversion rate: % who moved to next stage
- Bar width: Visual representation
Key metric: Install rate = Installs / Pageviews
Typical good rates:
- Add-to-Cart rate: 10-20%
- Install rate: 2-5%
Traffic Sources Table
Where your visitors come from:
Columns:
- Source: Google, Direct, Shopify App Store, etc.
- Pageviews: Traffic volume
- Clicks: Add app clicks from this source
- Installs: Conversions from this source
- Install Rate: Conversion % for this source
What to do:
- Double down on high-converting sources
- Investigate low-converting sources
- Compare paid vs organic performance
Top Countries Chart
Geographic breakdown of installs:
- Bar chart: Top 10 countries
- Color coded: Easy to distinguish
- Hover for details: Exact counts
Use this to:
- Understand your market
- Plan localization
- Target marketing campaigns
- Identify expansion opportunities
What Data You See
Without Integrations
- Category rankings
- Keyword rankings
- Public reviews and ratings
- Last updated date
- App store position
With Partner API
Plus:
- Revenue and MRR
- Customer counts
- Subscription changes
- Churn rates
- Customer details
With BigQuery
Plus:
- Pageviews and sessions
- Traffic sources
- Geographic data
- Device breakdown
- Conversion funnel
- Click events
Tips for Using Your Dashboard
Daily Check (2 minutes)
- Quick look at Overview cards
- Note any major changes
- Check yesterday's metrics
Weekly Review (10 minutes)
- Look at 7-day trends
- Compare to previous week
- Analyze traffic sources
- Check geographic performance
Monthly Review (30 minutes)
- Switch to 30-day view
- Identify patterns and trends
- Compare to previous month
- Plan next month's strategy
Understanding Percentage Changes
Green positive numbers mean:
- ↑ 25% = 25% increase vs previous period
- Good for pageviews, clicks, installs, revenue
Red negative numbers mean:
- ↓ 15% = 15% decrease vs previous period
- Needs investigation
No change:
- 0% = Same as previous period
- Could be stability or stagnation
When Data Might Be Missing
No traffic data?
- Check if BigQuery is connected
- Verify GA4 is tracking properly
- Check date range selection
No revenue data?
- Connect Partner API
- Wait for initial sync to complete
- Check sync status in Settings
Old data only?
- Check last sync time
- Trigger manual sync
- Verify integrations are still connected
Common Questions
Q: How often does data update? A: Daily automatic syncs. Manual sync available in Settings.
Q: Why don't numbers match Partner Dashboard? A: Time zones, calculation methods, or sync timing may differ. Try full sync.
Q: Can I export dashboard data? A: Yes, use export buttons on individual charts and tables.
Q: What's a good install rate? A: 2-5% is typical. Above 5% is excellent. Below 1% needs improvement.
Q: How do I compare to other apps? A: Browse similar apps to see their public metrics and rankings.
Next Steps
Explore more analytics pages:
- Category Analytics - Track rankings by category
- Search Analytics - Keyword performance
- Partner Metrics - Revenue deep dive
- Traffic Analytics - BigQuery exploration
- Customer Management - View your customers
Need help? Contact [email protected] or use the chat widget.