App Store Pulse
The App Store Pulse dashboard gives you a bird's-eye view of the entire Shopify App Store ecosystem. Track growth trends, monitor new app launches, and understand market dynamics.
Accessing App Store Pulse
Click App Store Pulse in the main navigation sidebar, located below Tracked Competitors.
Date Range Filter
Select your analysis period using the date range dropdown:
- Last 7 days: Recent trends
- Last 30 days: Monthly overview (default)
- Last 90 days: Quarterly patterns
- Last year: Long-term trends
All charts and metrics update automatically when you change the date range.
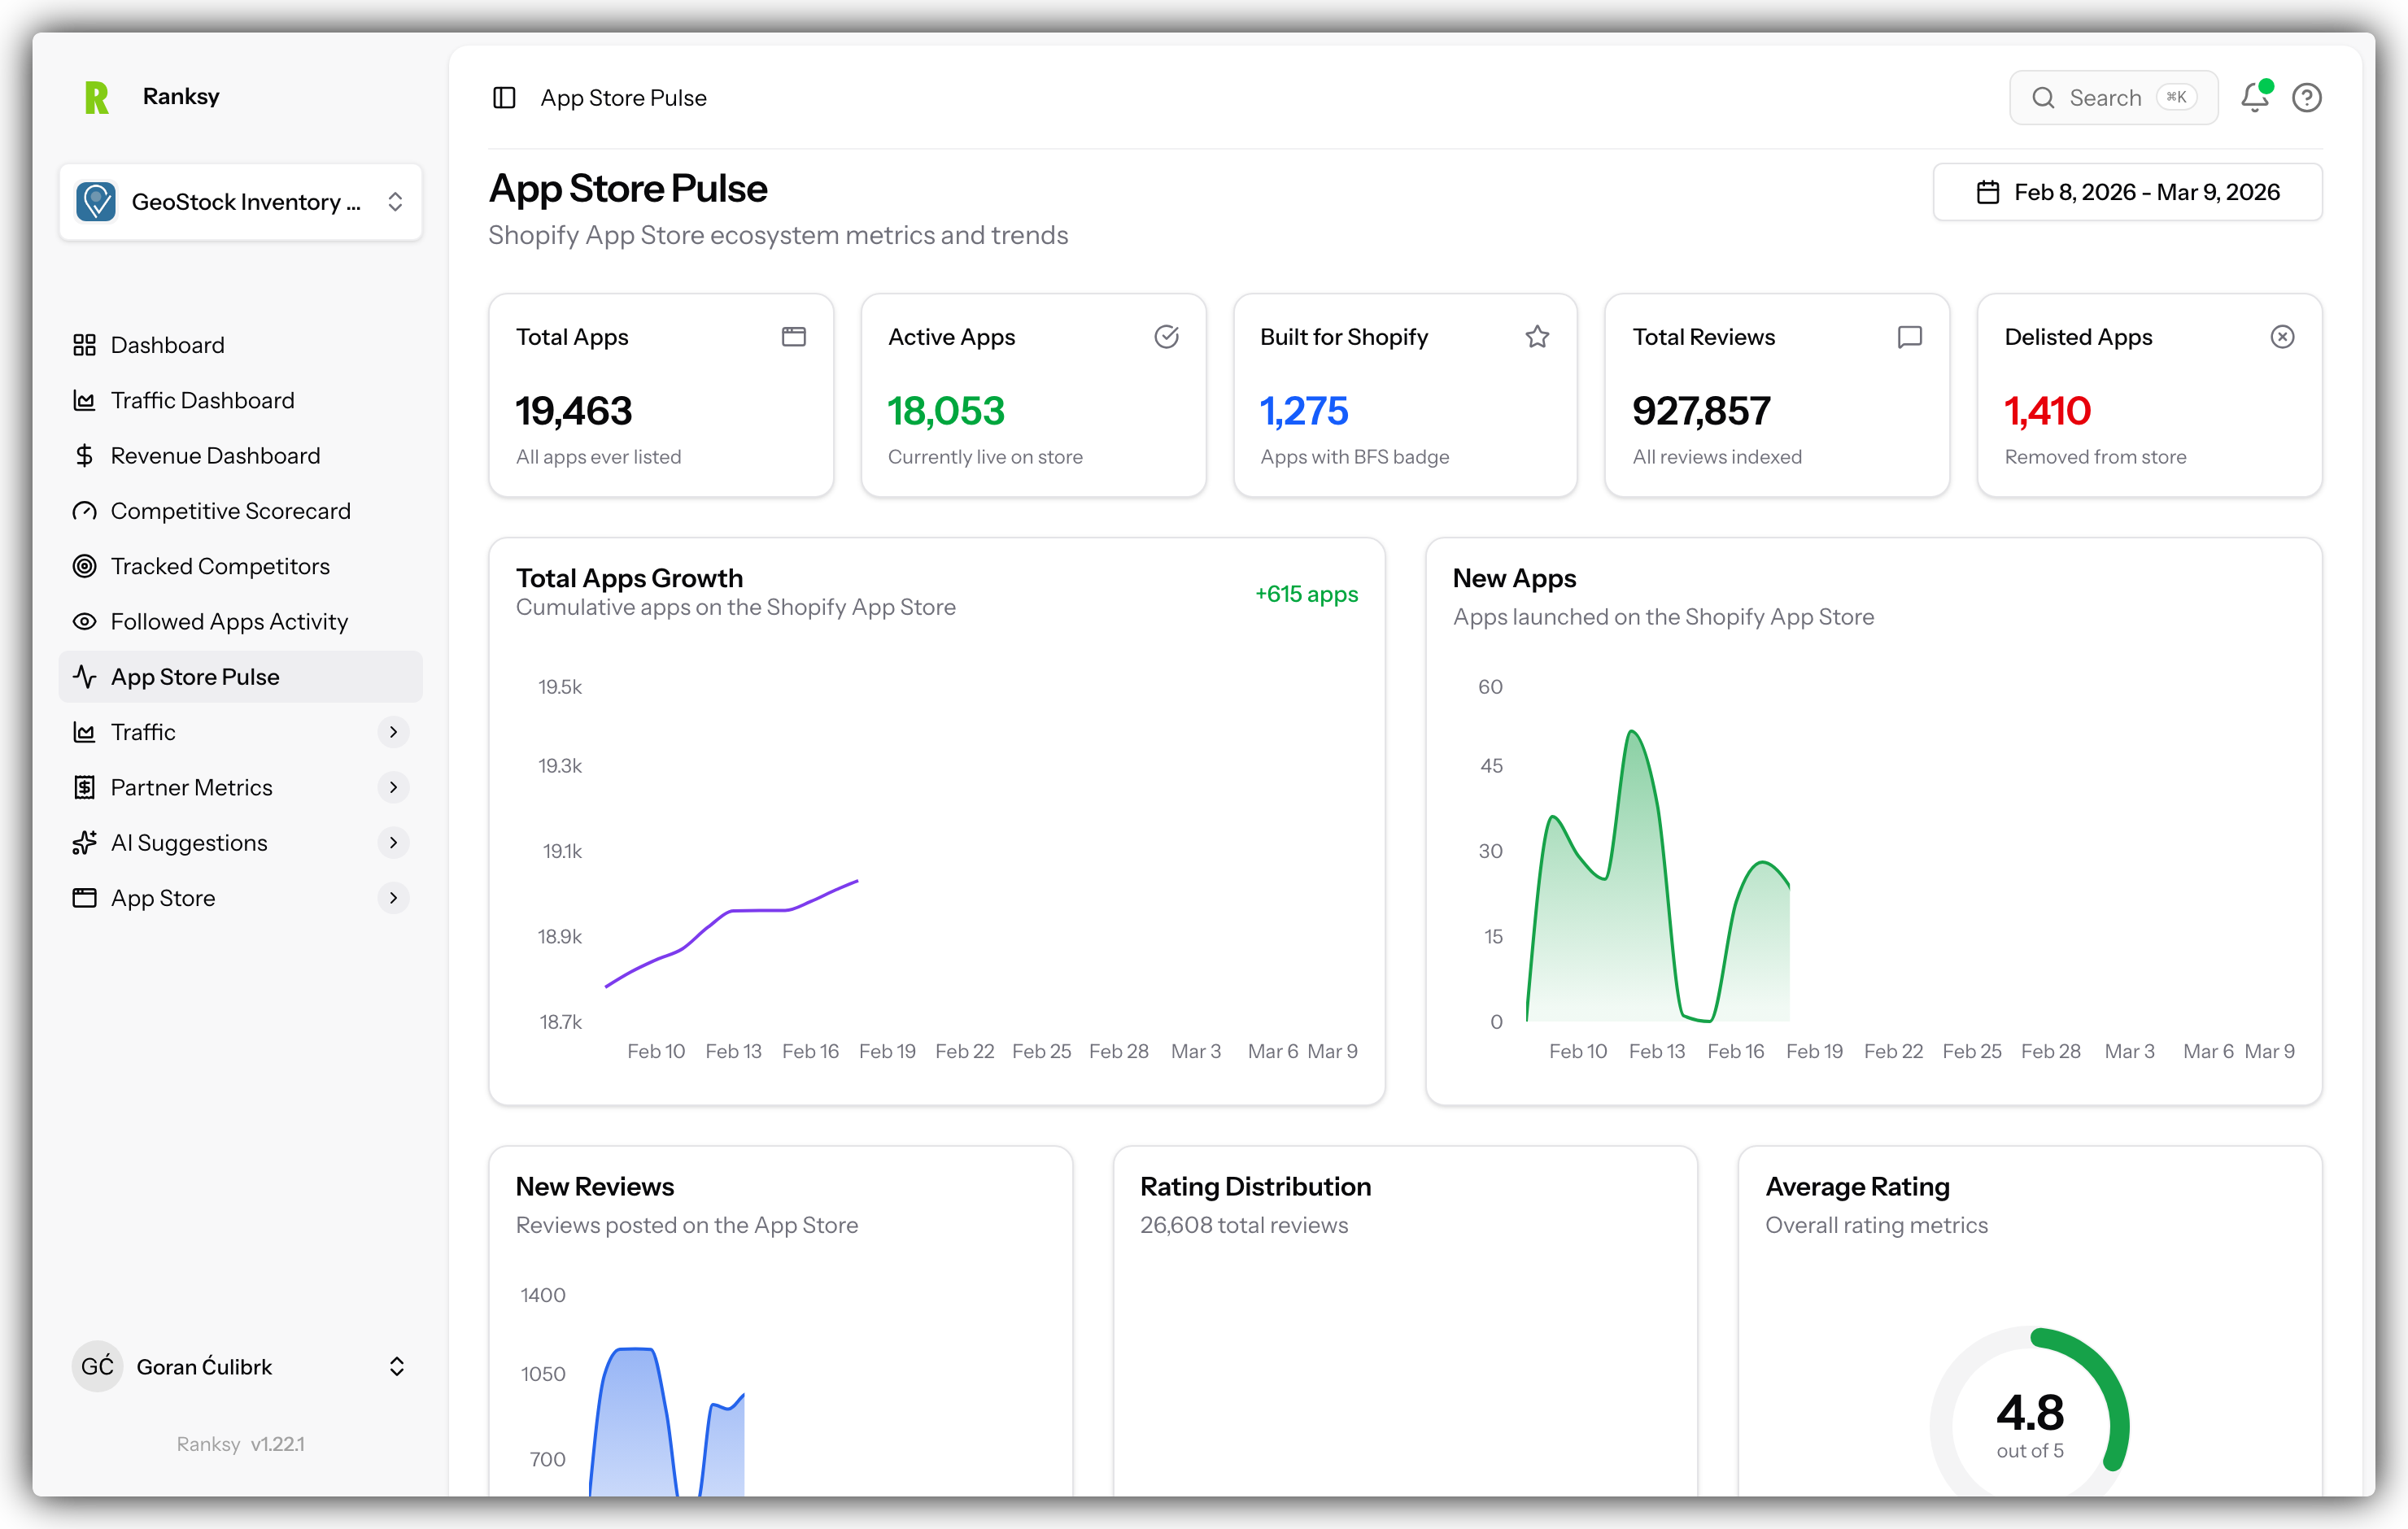
Overview Cards
Five key metrics provide a snapshot of the ecosystem:
Total Apps
The total number of apps ever listed on the Shopify App Store, including both active and delisted apps.
Active Apps
Currently live apps on the store. This excludes apps that have been delisted or removed.
Built for Shopify
Apps that have earned the "Built for Shopify" badge. These apps meet Shopify's highest standards for quality, performance, and user experience.
Total Reviews
The total number of reviews indexed across all apps in our database.
Delisted Apps
Apps that have been removed from the Shopify App Store. This helps you understand churn in the ecosystem.
Charts
Total Apps Growth
A line chart showing the cumulative growth of apps on the store over your selected time period.
What to look for:
- Steep upward trend: Healthy ecosystem growth
- Flattening curve: Market maturation
- Growth rate: Compare start and end values
The chart uses a dynamic Y-axis that starts near your data range, making growth patterns more visible even with large numbers.
The header shows the net change in apps during your selected period (e.g., "+127 apps").
New Apps per Day
An area chart displaying daily app launches.
What to look for:
- Spikes: Increased developer activity, possibly around Shopify events
- Dips: Weekends, holidays, or slower periods
- Trends: Is daily launch rate increasing or decreasing?
New Reviews per Day
An area chart showing daily review activity across the entire App Store.
What to look for:
- High activity: More merchants engaging with apps
- Patterns: Weekly or seasonal trends
- Spikes: May indicate major app updates or marketing campaigns
Rating Distribution
A pie chart showing the distribution of reviews by star rating (1-5 stars) within your selected date range.
What to look for:
- High 5-star concentration: Healthy ecosystem with satisfied merchants
- Rating spread: Understanding sentiment distribution
- Low ratings: Potential market pain points to address
Average Rating
A radial chart displaying the weighted average rating across all reviews in your selected period, with the median rating shown below.
What to look for:
- Average vs Median: Large differences may indicate rating skew
- Trend over time: Compare different date ranges
Top Categories Bar Chart
A horizontal bar chart showing the 10 most popular categories by app count.
What this tells you:
- Market saturation: Categories with the most apps
- Competition levels: Higher counts mean more competition
- Opportunity areas: Compare with less crowded categories
Use this for:
- Competitive research
- Market positioning decisions
- Identifying crowded vs. underserved markets
Use Cases
Market Research
Understand the overall health and direction of the Shopify App Store:
- Check total app growth trends
- Monitor daily launch rates
- Identify seasonal patterns
- Track category popularity
Competitive Landscape
Gauge the competitive environment:
- See how many new competitors launch daily
- Track BFS badge trends in your space
- Understand category saturation
- Monitor ecosystem churn
Timing Decisions
Plan your app launches and updates:
- Identify high-activity periods
- Avoid launching during quiet periods
- Time announcements with ecosystem trends
Investor/Stakeholder Reports
Provide context for your app's performance:
- Show overall market growth
- Compare your growth to ecosystem trends
- Demonstrate market opportunity
Tips for Analysis
Compare Periods
- Switch between 7-day and 30-day views
- Look for consistent patterns
- Identify anomalies or outliers
Combine with Other Data
Use App Store Pulse alongside:
- Your app's performance metrics
- Competitor tracking data
- Category ranking trends
Track Over Time
Make App Store Pulse part of your regular review:
- Weekly: Quick check on new apps and reviews
- Monthly: Analyze trends and patterns
- Quarterly: Strategic planning and market assessment
FAQ
Q: How often is the data updated? A: Data syncs daily. New apps and reviews are detected within 24 hours.
Q: Does this include all Shopify App Store apps? A: Yes, we track the complete Shopify App Store including all categories and regions.
Q: Can I filter by category? A: The current view shows ecosystem-wide metrics. Use Browse Apps for category-specific research.
Q: Why might new app counts vary day to day? A: Developer activity fluctuates based on weekdays vs. weekends, holidays, and Shopify events.
Q: How is "delisted" different from "deleted"? A: Both represent apps removed from the store. The total reflects apps no longer available to merchants.
Q: Can I export this data? A: Export functionality for ecosystem data is on our roadmap.
Want to track specific competitors? Visit Tracked Competitors to monitor individual apps.