Search Analytics
Search Analytics reveals how users find your app through Shopify App Store search and which keywords drive the most traffic and conversions.
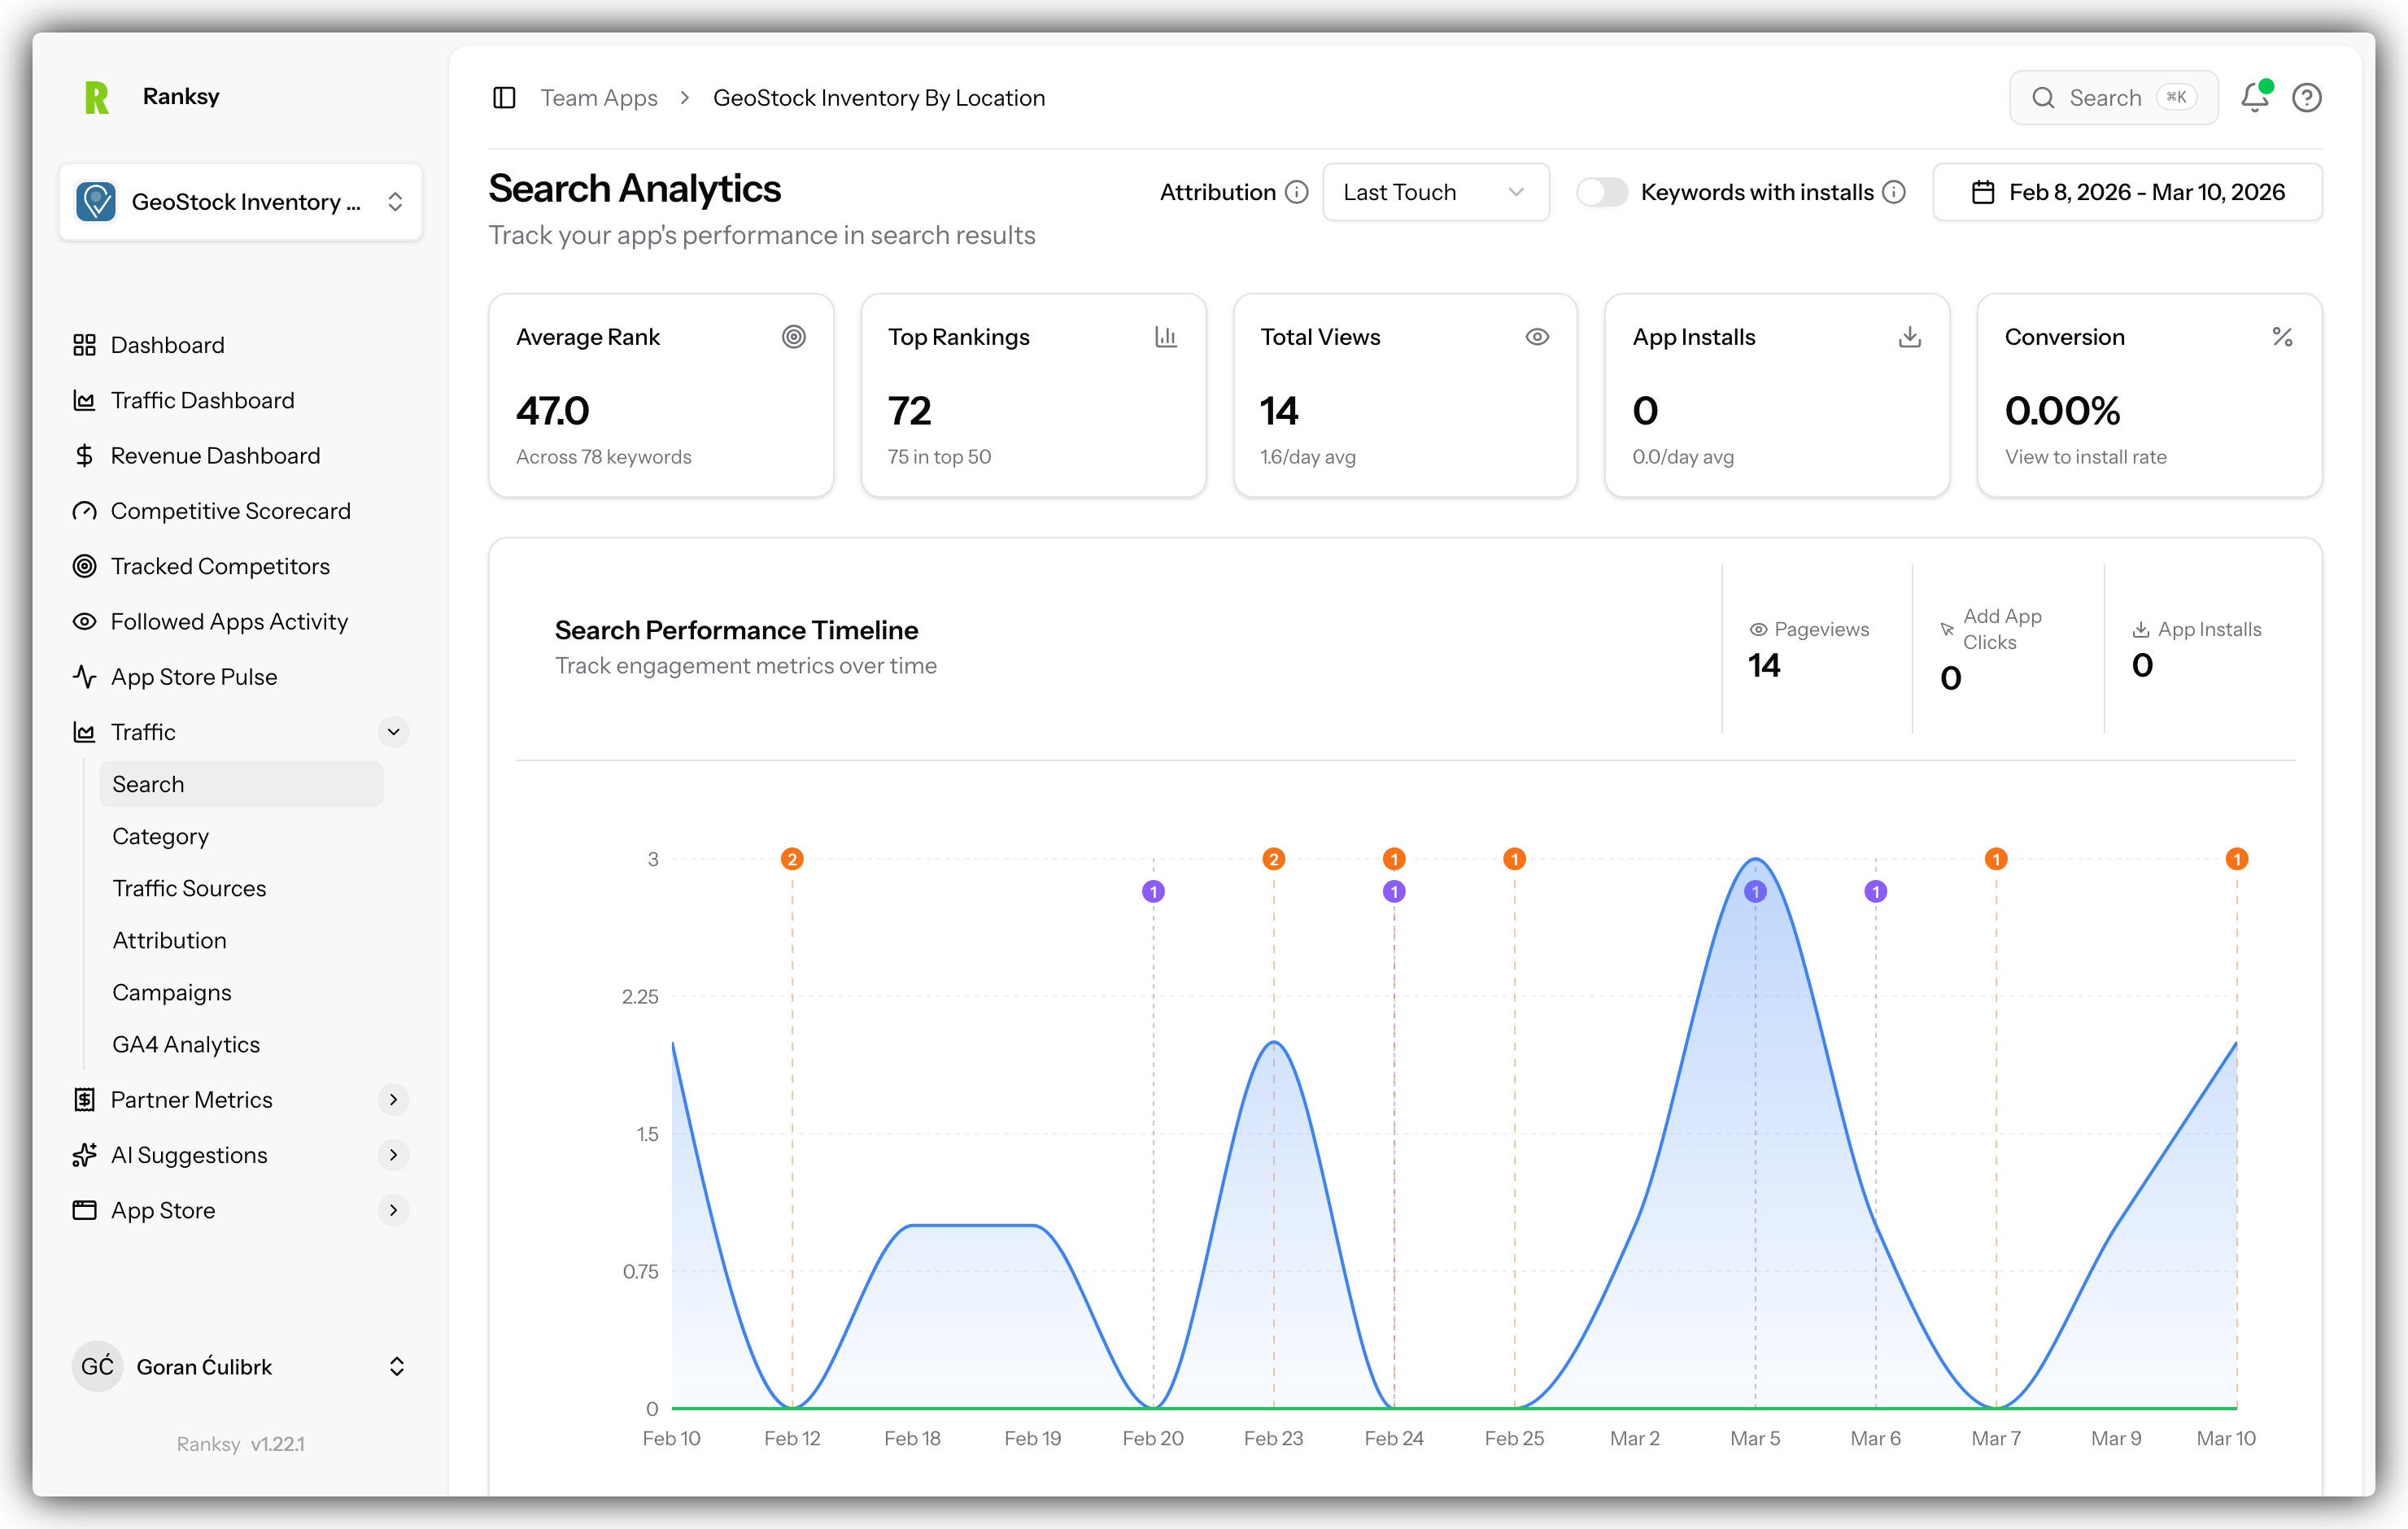
Accessing Search Analytics
- Go to My Apps and select your app
- Click Search in the sidebar navigation
- Your keyword performance data will load
Overview Metrics
The top cards show your overall search performance:
Total Keywords Tracked
- All keywords where your app appears in search results
- Updated daily with ranking checks
Keywords in Top 10
- Number of keywords where you rank #1-10
- Prime visibility positions
Keywords in Top 50
- Keywords where you rank #1-50
- Total search footprint
Average Rank
- Mean position across all tracked keywords
- Lower is better
Best Performing Keyword
- Your highest-ranking keyword
- Focus your optimization here
Search Performance Chart
Dual-Axis Timeline
The chart shows two key metrics together:
Left Axis (Inverted): Average Keyword Ranking
- Shows ranking over time
- Lower line = better rankings
Right Axis: Search Events
- Pageviews from search
- Clicks from search results
- Installs from search
Using the Chart
- Hover for exact values on any date
- Select date range in the top right
- Look for correlation between rankings and traffic
- Identify the impact of app updates
Key Insight: When rankings improve, traffic should follow within 24-48 hours.
Keyword Performance Table
Data Per Keyword
Each row shows:
| Column | Description |
|---|---|
| Keyword | The search term |
| Current Rank | Today's position |
| Change | Movement vs previous period |
| Sessions | Visits from this keyword |
| Pageviews | Page loads from keyword |
| Clicks | "Add app" button clicks |
| Installs | Conversions from keyword |
| Conversion Rate | Install rate |
Sorting and Filtering
- Click any column header to sort
- Use search to find specific keywords
- Paginate through large keyword lists
Expandable Details
Click any keyword row to see:
Geographic Breakdown
- Top countries searching this keyword
- Sessions and conversions by region
Device Breakdown
- Desktop vs Mobile vs Tablet
- Performance by device type
Traffic Sources
- Organic vs paid search
- Referral sources
Daily Trends
- Sparkline showing keyword performance
- Day-by-day patterns
Search Conversion Funnel
The Complete Journey
Track users from search to customer:
- Search Impressions - Your app appears in results
- Search Clicks - User clicks to your listing
- Pageviews - User views your app page
- Add App Clicks - User clicks install button
- Installs - Installation completed
- Trial Starts - User begins trial (Partner API)
- Paid Customers - Conversion to paid (Partner API)
Funnel Insights
- See drop-off at each stage
- Compare funnels between keywords
- Identify high-converting keywords
- Calculate ROI per keyword
Note: Complete funnel requires both BigQuery and Partner API connected.
Top Keywords Leaderboard
Rankings By Different Metrics
By Pageviews
- Keywords driving the most traffic
- Visibility champions
By Clicks
- Keywords generating interest
- Intent indicators
By Installs
- Keywords converting best
- Revenue drivers
By Conversion Rate
- Most efficient keywords
- Quality over quantity
Keyword Optimization Strategy
Quick Wins (Positions 11-20)
Focus here first:
- Small ranking improvements = big visibility gains
- These keywords are almost in the top 10
- Optimize listing for these terms
Long-tail Keywords
Often overlooked but valuable:
- Lower competition
- Higher conversion rates
- More specific intent
- Easier to rank for
Competitor Keywords
Find opportunities:
- Keywords where competitors rank
- Your position vs theirs
- Gap analysis for opportunities
Best Practices
Weekly Keyword Review
- Check ranking changes
- Identify significant movements (+/- 5 positions)
- Correlate with any app updates
- Adjust optimization strategy
Monthly Optimization
- Analyze 30-day keyword trends
- Identify growth keywords to double down on
- Deprioritize consistently poor performers
- Plan content and listing updates
After App Updates
- Monitor ranking impacts (48-72 hours)
- Track traffic changes
- Measure conversion effects
- Document what worked
Understanding Ranking Factors
What Affects Rankings
- App Quality: Rating and reviews
- Relevance: Keyword in name/description
- Performance: Conversion rates
- Engagement: User activity signals
- Recency: How recently you updated
Common Patterns
Post-Update Boost
- Updates often improve rankings
- Effect visible within 24-48 hours
- Sustained if quality maintained
Gradual Decline
- Lack of updates
- Competitor improvements
- Declining review quality
High Volatility
- New keywords (establishing position)
- High competition
- Algorithm adjustments
FAQ
Q: How often are rankings checked? A: Daily for all tracked keywords.
Q: Can I add custom keywords to track? A: Yes, use the keyword management feature in Settings.
Q: Why did my ranking suddenly drop? A: Could be algorithm changes, competitor updates, or review changes. Check recent activity.
Q: How many keywords should I track? A: Focus on 20-50 core keywords. Quality over quantity.
Q: What's a good conversion rate from search? A: 2-5% install rate from search is typical. Above 5% is excellent.
Q: Can I see what keywords competitors rank for? A: Yes, use the Competitive Intelligence feature to analyze followed apps.
Want to improve your keyword rankings? Check out AI Keyword Suggestions for personalized recommendations.