Revenue Dashboard
The Revenue Dashboard (Partner Metrics) provides complete financial and subscription analytics powered by your Shopify Partner account data.
Prerequisites
Before using Revenue Dashboard, you need:
- Partner API Connected - Connect your Shopify Partner API
- Initial Sync Complete - Wait for data to sync (usually a few minutes)
If you haven't set this up yet, see Connect Partner API.
Accessing Revenue Dashboard
- Go to My Apps and select your app
- Click Revenue in the sidebar navigation
- Your revenue metrics and charts will load
Dashboard Sections
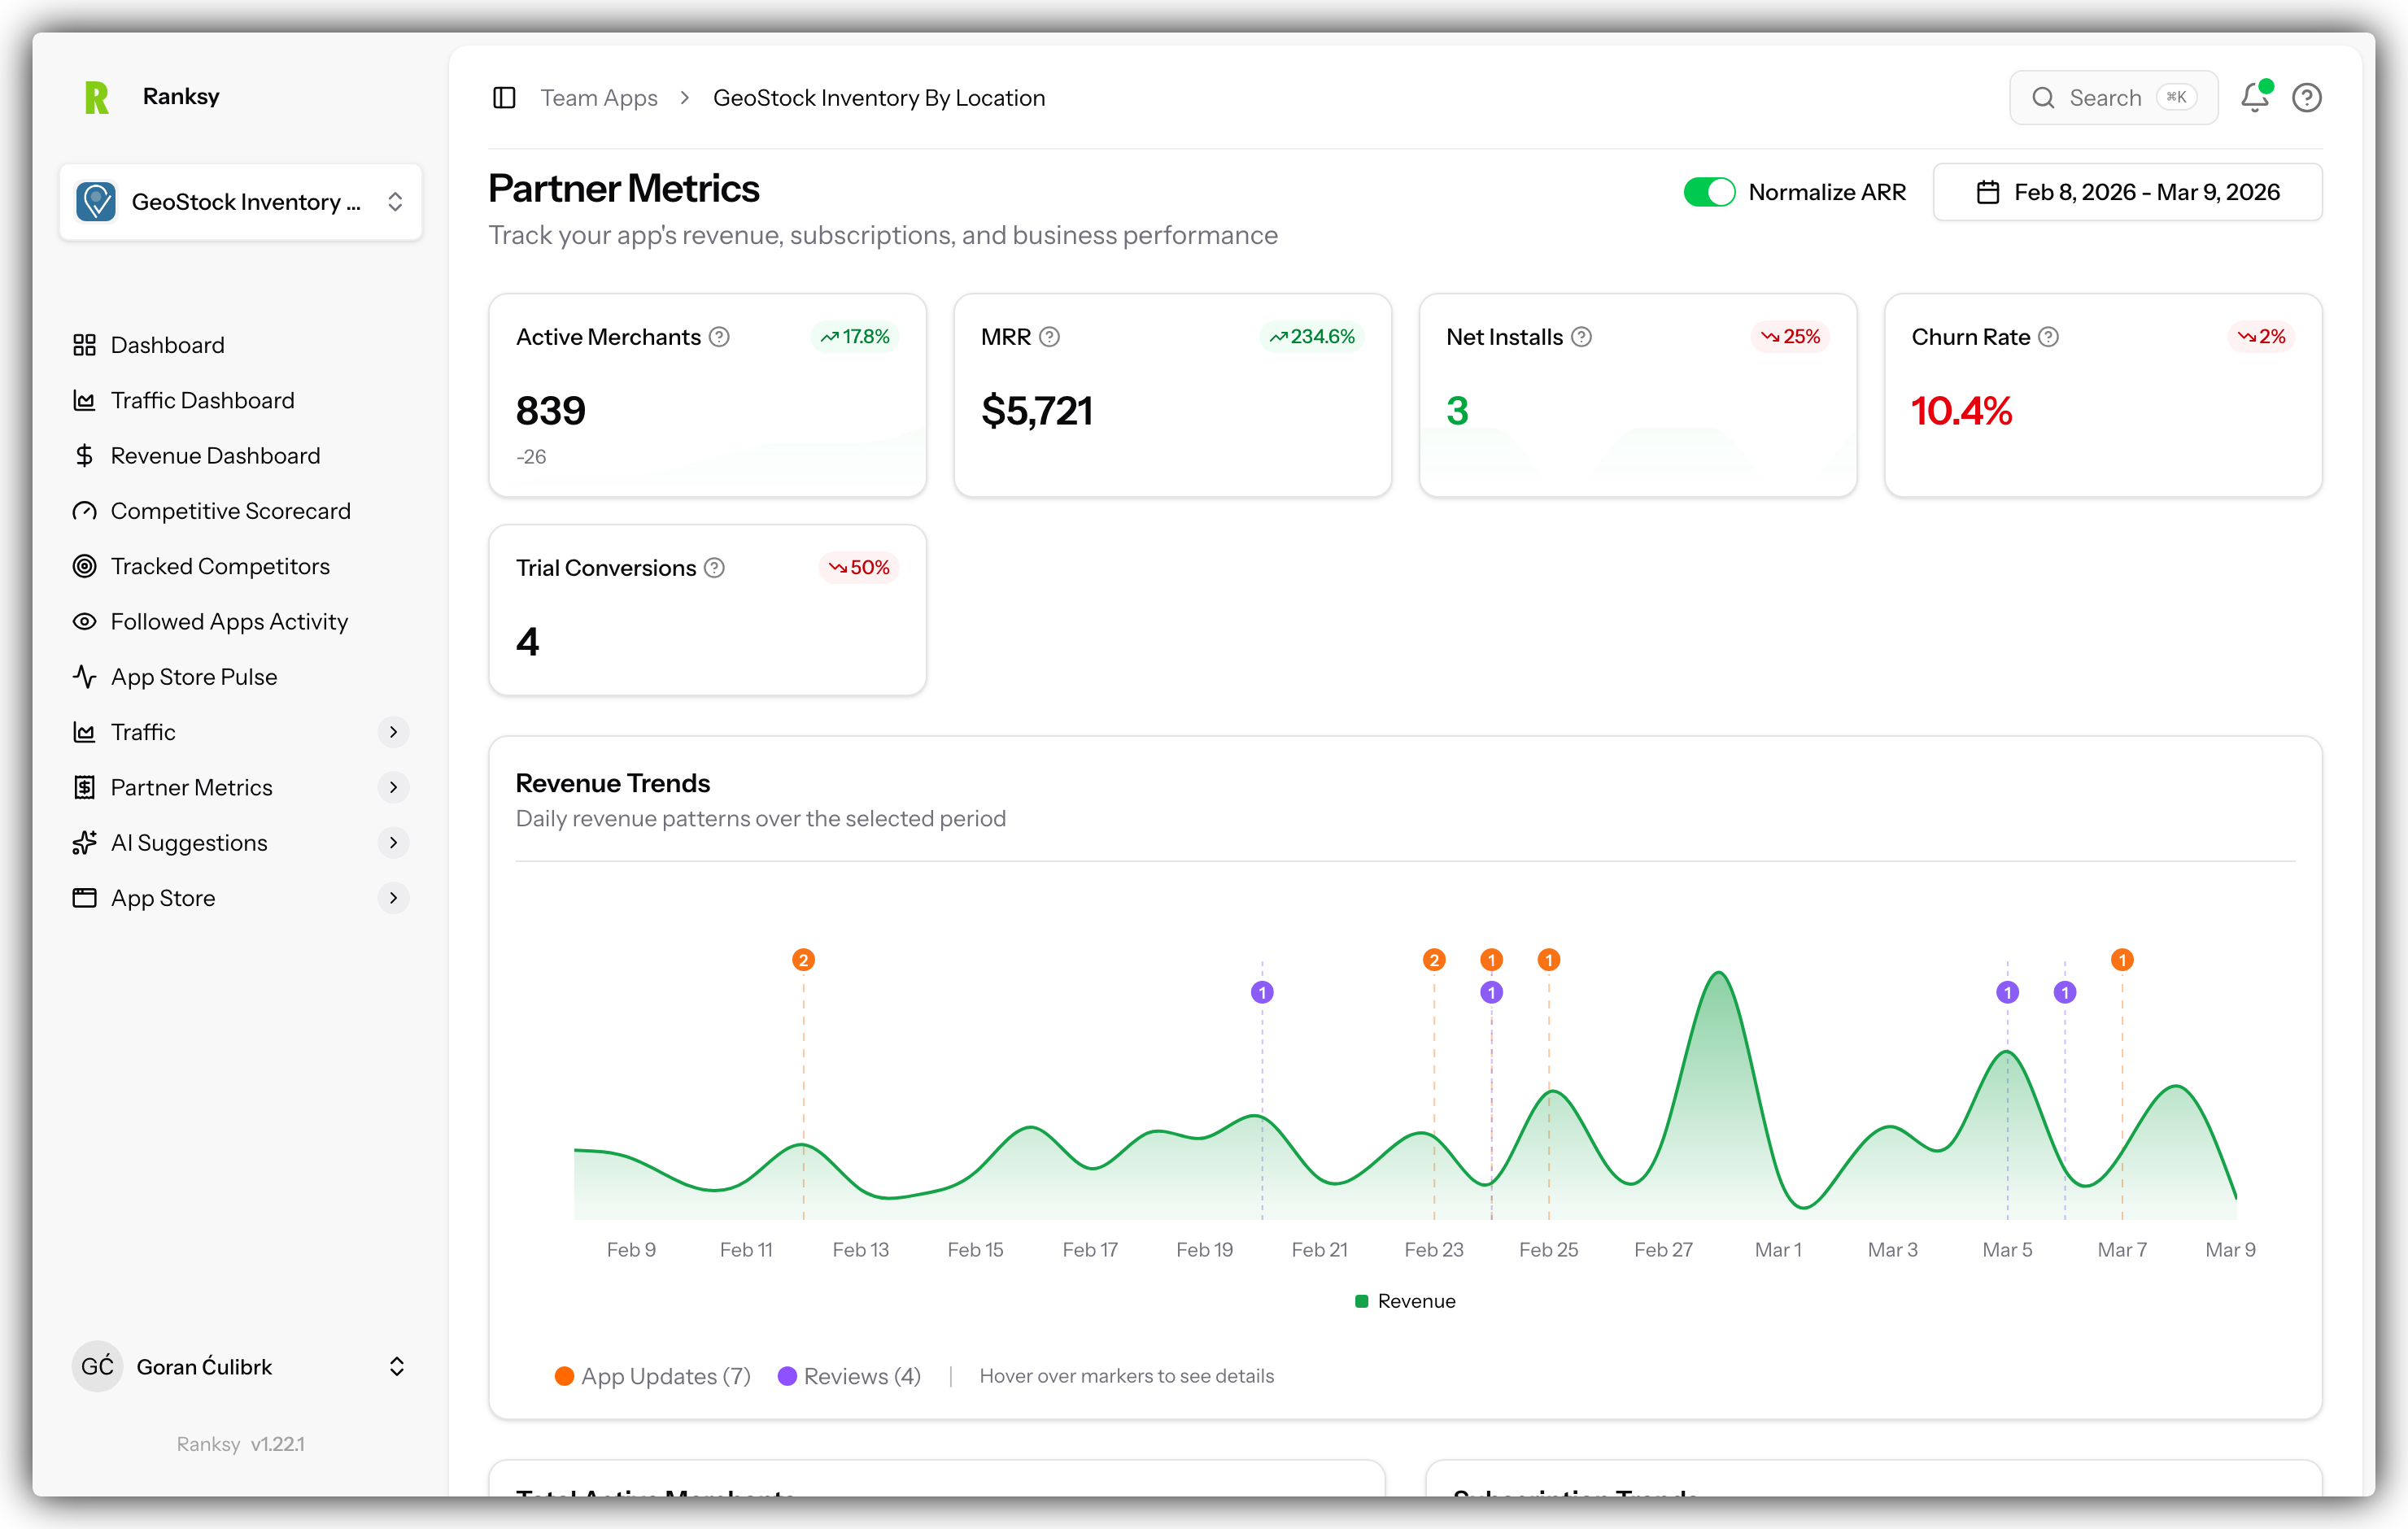
MRR Overview
The top section shows your key revenue metrics:
Current MRR
- Your real-time monthly recurring revenue
- Color-coded trend indicator
MRR Growth Rate
- Month-over-month percentage change
- Green = growing, Red = declining
30-Day Revenue
- Total revenue in the last 30 days
- Includes all subscription types
Total Customers
- Count of paying merchants
- Active subscriptions only
MRR Trend Chart
Interactive chart showing:
- Historical MRR over time
- Daily/weekly/monthly granularity
- Trend lines for forecasting
- Hover for exact values
What to look for:
- Steady upward trend = healthy growth
- Plateaus = acquisition or churn issues
- Sharp drops = investigate immediately
Revenue Composition
Breakdown of your revenue by:
New Revenue
- From first-time customers
- Indicates acquisition success
Expansion Revenue
- From upgrades and add-ons
- Often more profitable than new
Contraction Revenue
- From downgrades
- Early warning signal
Churn Revenue
- Lost from cancellations
- Key metric to minimize
Subscription Lifecycle
Track all subscription movements:
| Event | Meaning |
|---|---|
| New Subscription | Fresh paying customer |
| Upgrade | Moved to higher tier |
| Downgrade | Moved to lower tier |
| Cancellation | Lost customer |
| Reactivation | Returned customer |
Installation Analytics
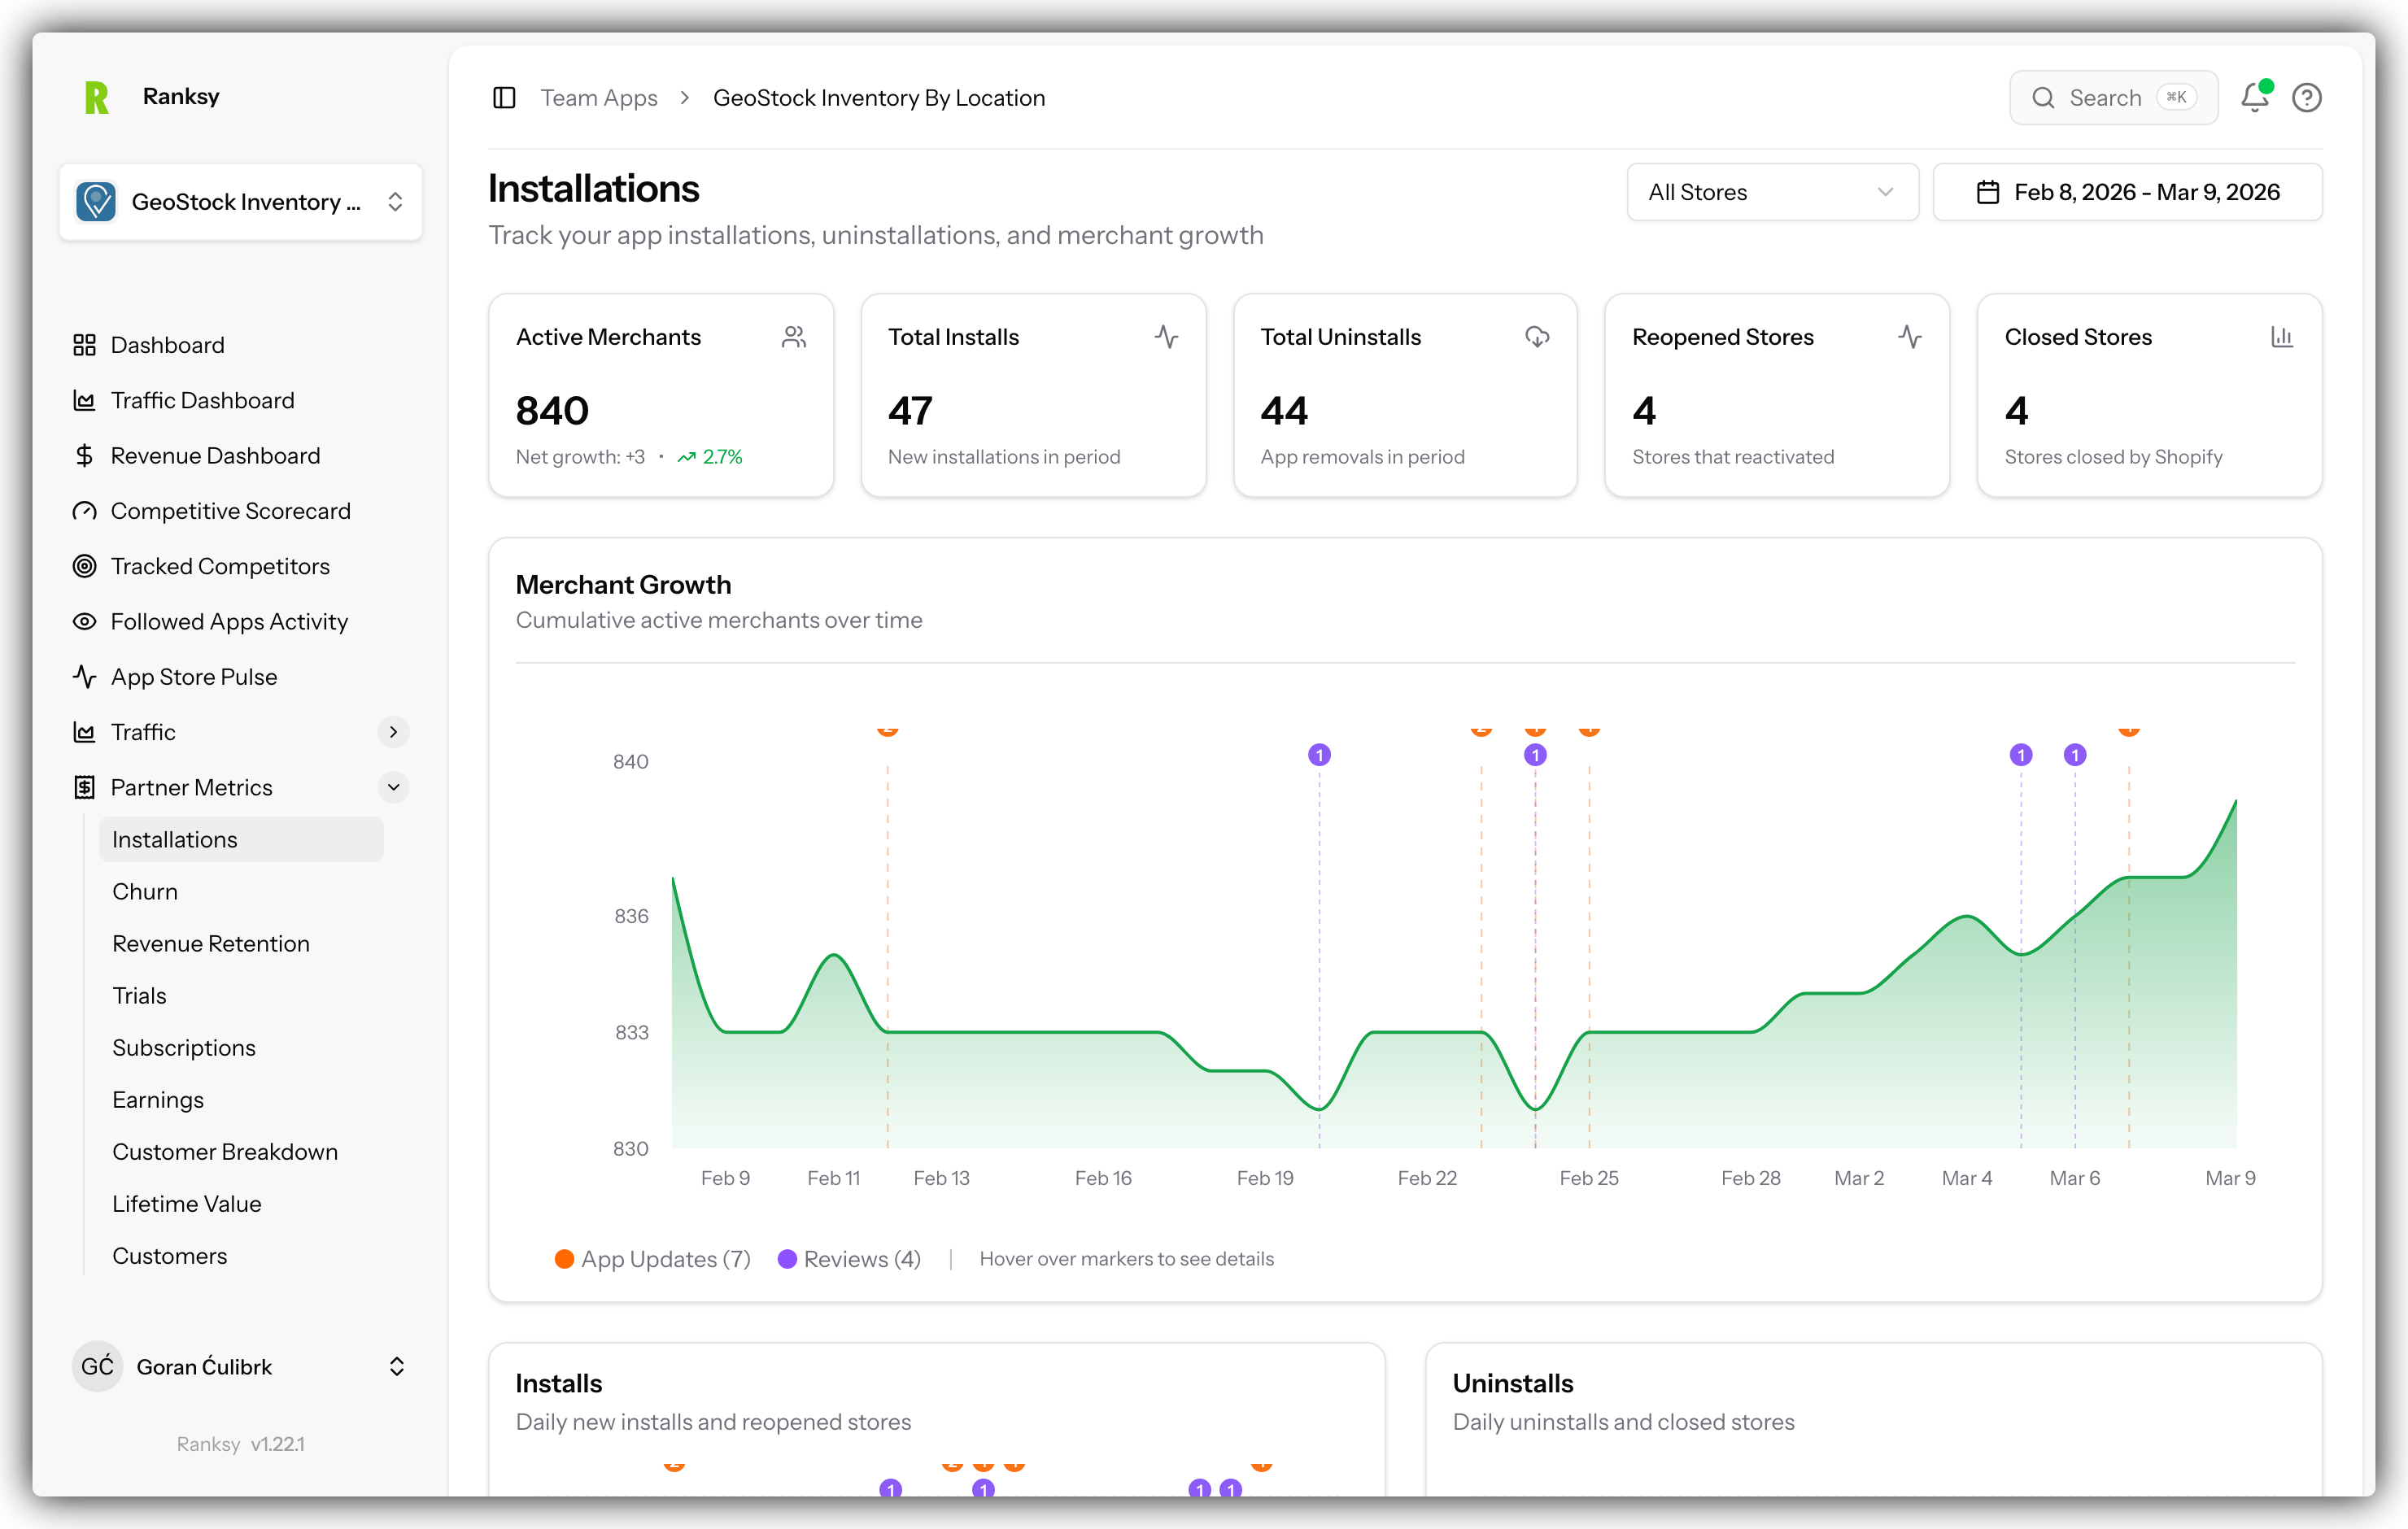
Install Funnel
Complete journey visualization:
- App Store Visits - From BigQuery (if connected)
- App Installs - Partner API data
- Active Users - Currently using
- Paying Customers - Converting to paid
Key Metrics
- Total Installs: Lifetime installations
- Install Trend: Daily installation patterns
- Time to Activation: Install to active use
- Trial-to-Paid Rate: Conversion percentage
Trial Conversion Analysis
Metrics Tracked
- Trial Start Rate: Installs that begin trials
- Trial-to-Paid Rate: Trials converting to paid
- Average Trial Duration: How long before converting
- Conversion by Plan: Which tiers convert best
Optimization Insights
Use this data to:
- Find the optimal trial length
- Identify conversion triggers
- Improve onboarding experience
- Adjust pricing strategy
Geographic Revenue
Revenue by Country
Visual map showing:
- Revenue concentration by region
- Customer count per country
- Average revenue per user (ARPU) by location
- Growth rates by market
Strategic Use
- Best Markets: Where to double down
- Growth Opportunities: High potential, low penetration
- Localization Needs: Language and currency gaps
- Marketing Focus: Where to concentrate spend
Churn Analysis
Churn Metrics
- Monthly Churn Rate: % customers lost monthly
- Revenue Churn: Dollar impact of churn
- Churn by Plan: Which tiers churn most
- Churn by Cohort: When customers leave
At-Risk Signals
Watch for these warning signs:
- Decreased usage patterns
- Failed payments
- Increased support tickets
- Feature engagement drops
Retention Strategies
Based on your data:
- Identify when to intervene
- Test retention offers
- Optimize communication timing
- Plan win-back campaigns
Customer Cohorts
Cohort Analysis
Track performance by:
- Acquisition Month: Long-term retention
- Plan Tier: Plan-specific patterns
- Channel: Acquisition source quality
- Geography: Regional differences
Lifetime Value (LTV)
Calculate and track:
- LTV by cohort
- LTV trends over time
- LTV by acquisition channel
- LTV forecasting
Best Practices
Daily Monitoring
Quick Check (2 minutes):
- Review current MRR
- Check for new customers
- Note any cancellations
- Monitor payment failures
Weekly Analysis
Deep Dive (15 minutes):
- Analyze churn patterns
- Review plan performance
- Check geographic trends
- Update cohort data
Monthly Strategy
Full Review (30 minutes):
- Complete financial review
- Pricing optimization check
- Retention initiative planning
- Expansion opportunities
Understanding Your Metrics
Healthy Indicators
- MRR growing month-over-month
- Net revenue retention > 100%
- Churn rate < 5% monthly
- Trial-to-paid rate > 2%
- Expansion revenue > churn revenue
Warning Signs
- MRR plateau or decline
- Increasing churn rate
- Declining trial conversion
- High contraction revenue
- Payment failure spikes
FAQ
Q: How often does revenue data sync? A: Daily automatic syncs. You can trigger manual sync in Settings.
Q: Why don't numbers match my Partner Dashboard exactly? A: Small differences due to time zones or calculation timing. Should be within 1%.
Q: Can I track revenue from multiple apps? A: Yes, each app has its own Revenue Dashboard. View aggregate in team dashboard.
Q: What's included in MRR calculation? A: All recurring subscriptions. One-time charges are tracked separately.
Q: How is churn rate calculated? A: (Customers lost in period) / (Customers at start of period) x 100
Q: Can I export revenue data? A: Yes, use export buttons on charts and tables for CSV download.
Need help understanding your metrics? Contact [email protected] for personalized guidance.